Re:
North County Times Article
Dear Mr. Downey...
Just a quick note on your story on Wednesday. There is no doubt but that the Coaster's ridership increase is related to the increasing price of fuel. On the other hand, it needs to be undestood that the Coaster ridership increase is but a small fraction of the reduction in driving along the I-5 corridor (a quick review of the data in your article and data from the USDOT and Caltans). It appears that the Coaster ridership is about 1/8th the decline in traffic.
Best regards,
Wendell Cox
2008/08/08
2008/08/04
Transit Market Share Inches Up
Transit Market Share Inches Up
Latest annual data available from the United States Department of Transportation indicates that the market share of transit rose slightly in 2006, from 1.51% of passenger miles to 1.55% in 2005. Over the same period, gas prices rose 13% in the United States.
Annual data is at US Personal Vehicle and Public Transport Market Share from 1900
Latest annual data available from the United States Department of Transportation indicates that the market share of transit rose slightly in 2006, from 1.51% of passenger miles to 1.55% in 2005. Over the same period, gas prices rose 13% in the United States.
Annual data is at US Personal Vehicle and Public Transport Market Share from 1900

Louvre Café Syndrome Strikes Neal Peirce: Misunderstanding Amsterdam and America
Louvre Café Syndrome Strikes Neal Peirce: Misunderstanding Amsterdam and America
Tourists, journalists and urban planners are often smitten with what might be called the “Louvre café syndrome.” This occurs when Americans sit at Paris cafes in view of the Louvre and imagine why it is that the United States does not look like this. In fact, most of Paris doesn’t even look like this, nor do other European urban areas. Like their US counterparts, European urban areas rely principally on cars for mobility (though to a somewhat lesser degree) and their residents live in suburbs that have been built since World War II.
The last example of Louvre Café Syndrome comes from Washington Post Writer’s Group columnist Neal Peirce, who suggests that Amsterdam, with its bicycles, is the model for America to follow in a time of high energy prices (See Multiple Transit Options -- A Dutch Treat We'll Be Needing.
Not only is this view incorrect, but Amsterdam is not even a model for the Netherlands. The largest urban areas of the Netherlands, Amsterdam and Rotterdam, have been “stuck in neutral” with respect to growth for at least 45 years. United Nations data indicates that since 1960, 97% of urban growth in the Netherlands has occurred outside these two large urban areas. While the population of the two largest urban areas has increased approximately 10%, the urban population outside these areas has increased 120%. And how do these urbanites that have chosen not to live in Amsterdam or Rotterdam travel? Try by car. Overall, in the Netherlands, approximately 85% of travel is by car --- a figure that is nearly identical to the United States. All of the subway and light rail ridership in the Netherlands is less than the annual increase in car use. Some model.
America is a growing nation. Between now and 2030, approximately two-thirds of the urban growth in the developed world is projected to occur in the United States --- that is a considerable number given the fact that the US accounts for less than one-third of the developed world’s urban population today. The strategies that work in urban areas with stagnant growth --- such as Amsterdam --- will not work here.
As for the bicycles, one could also point to walking and the large share of travel that it represents in Manhattan or the Chicago Loop. A European felled by Louvre Café Syndrome might visit these places and imagine that the urban area looks the same all the way to the urban fringe --- that the citizens of New Brunswick, Westfield or Aurora live in residential skyscrapers and that they walk everywhere. Such a view would be as faulty as Peirce’s vision of Amsterdam.
It helps to think of things in context. Amsterdam would barely rank in the top 50 metropolitan areas of the United States. The Netherlands has a population less than that of two American metropolitan areas (combined statistical areas), New York and Los Angeles. Finally, all of the Netherlands --- urban and rural areas --- would fit into an area approximately 1.5 times that of the New York metropolitan area.
You can’t see everything from the Louve.
Wendell Cox
Visiting Professor, Conservatoire National des Arts et Metiers, Paris
Related articles: Little of Driving Decrease Captured by Transit
Tourists, journalists and urban planners are often smitten with what might be called the “Louvre café syndrome.” This occurs when Americans sit at Paris cafes in view of the Louvre and imagine why it is that the United States does not look like this. In fact, most of Paris doesn’t even look like this, nor do other European urban areas. Like their US counterparts, European urban areas rely principally on cars for mobility (though to a somewhat lesser degree) and their residents live in suburbs that have been built since World War II.
The last example of Louvre Café Syndrome comes from Washington Post Writer’s Group columnist Neal Peirce, who suggests that Amsterdam, with its bicycles, is the model for America to follow in a time of high energy prices (See Multiple Transit Options -- A Dutch Treat We'll Be Needing.
Not only is this view incorrect, but Amsterdam is not even a model for the Netherlands. The largest urban areas of the Netherlands, Amsterdam and Rotterdam, have been “stuck in neutral” with respect to growth for at least 45 years. United Nations data indicates that since 1960, 97% of urban growth in the Netherlands has occurred outside these two large urban areas. While the population of the two largest urban areas has increased approximately 10%, the urban population outside these areas has increased 120%. And how do these urbanites that have chosen not to live in Amsterdam or Rotterdam travel? Try by car. Overall, in the Netherlands, approximately 85% of travel is by car --- a figure that is nearly identical to the United States. All of the subway and light rail ridership in the Netherlands is less than the annual increase in car use. Some model.
America is a growing nation. Between now and 2030, approximately two-thirds of the urban growth in the developed world is projected to occur in the United States --- that is a considerable number given the fact that the US accounts for less than one-third of the developed world’s urban population today. The strategies that work in urban areas with stagnant growth --- such as Amsterdam --- will not work here.
As for the bicycles, one could also point to walking and the large share of travel that it represents in Manhattan or the Chicago Loop. A European felled by Louvre Café Syndrome might visit these places and imagine that the urban area looks the same all the way to the urban fringe --- that the citizens of New Brunswick, Westfield or Aurora live in residential skyscrapers and that they walk everywhere. Such a view would be as faulty as Peirce’s vision of Amsterdam.
It helps to think of things in context. Amsterdam would barely rank in the top 50 metropolitan areas of the United States. The Netherlands has a population less than that of two American metropolitan areas (combined statistical areas), New York and Los Angeles. Finally, all of the Netherlands --- urban and rural areas --- would fit into an area approximately 1.5 times that of the New York metropolitan area.
You can’t see everything from the Louve.
Wendell Cox
Visiting Professor, Conservatoire National des Arts et Metiers, Paris
Related articles: Little of Driving Decrease Captured by Transit
2008/08/03
World Urban Areas Strong Association Between Lower Density & Higher Incomes
The latest Demographia world urban area population estimates confirm the strong association between lower urban population densities and higher incomes (gross domestic product per capita on a purchasing power parity basis).
A linear regression analysis indicated a 0.300 “R2,” for 138 geographies (nations and separate territories), using the population density of urban areas (urban agglomerations, or urban footprints) with 500,000 or more population. This is significant at the 99% confidence level. The analysis included all of the 740 world’s urban areas with more than 500,000 population.
The data shows an association such that each percentage point increase urban density is associated with a nearly 0.8 percentage point decline in gross domestic product per capita. The data is illustrated in charts on pages 88 and 89 of the following recently report, released today.
Demographia World Urban Areas: Population & Density
Current population estimates and population projections were also released for all urban areas expected to have a population of 2,000,000 or more in 2030:
Demographia World Urban Areas: 2025 & 2030 Population Projections
A linear regression analysis indicated a 0.300 “R2,” for 138 geographies (nations and separate territories), using the population density of urban areas (urban agglomerations, or urban footprints) with 500,000 or more population. This is significant at the 99% confidence level. The analysis included all of the 740 world’s urban areas with more than 500,000 population.
The data shows an association such that each percentage point increase urban density is associated with a nearly 0.8 percentage point decline in gross domestic product per capita. The data is illustrated in charts on pages 88 and 89 of the following recently report, released today.
Demographia World Urban Areas: Population & Density
Current population estimates and population projections were also released for all urban areas expected to have a population of 2,000,000 or more in 2030:
Demographia World Urban Areas: 2025 & 2030 Population Projections
2008/08/01
"SmartMoney.com" Misses by 85% on Transit
SMART MONEY MISSES BY 85 PERCENT
Smartmoney.com reports on the increase in transit ridership, posted at “yahoofinance.com:”
Thanks to sky-high fuel costs, public transit ridership is at its highest level in 50 years, according to the American Public Transportation Association, an industry group. In the first quarter of this year, riders took 51% more trips on subways, commuter rails, streetcars, trolleys and buses than they did during the same period in 2007.
Actually the American Public Transportation Association has reported a 3.4% increase in ridership. Smartmoney.com missed the mark by about 85%.
There is no doubt that the increase in transit ridership is due to high gas prices. On the other hand, much of a “clueless” media has missed an even bigger point --- that more than 97% of the decline in car travel has not transferred to transit.
Smartmoney.com reports on the increase in transit ridership, posted at “yahoofinance.com:”
Thanks to sky-high fuel costs, public transit ridership is at its highest level in 50 years, according to the American Public Transportation Association, an industry group. In the first quarter of this year, riders took 51% more trips on subways, commuter rails, streetcars, trolleys and buses than they did during the same period in 2007.
Actually the American Public Transportation Association has reported a 3.4% increase in ridership. Smartmoney.com missed the mark by about 85%.
There is no doubt that the increase in transit ridership is due to high gas prices. On the other hand, much of a “clueless” media has missed an even bigger point --- that more than 97% of the decline in car travel has not transferred to transit.
2008/07/09
Changing US Car Purchase Preferences Improve Fuel Economy, GHG Emissions
Fuel prices have induced the purchase of more fuel efficient vehicles in the United States. This is the Demographia finding from an analysis of the 10 most popular automobiles and sport utility vehicles (SUVs), as reported by Ward’s Automotive.
In the first 6 months of 2008, the average fuel economy of these 20 vehicles was 23.7 miles per gallon. This is an improvement of nearly 4 percent from 2007. Over the period, the share of SUVs among these vehicles fell from 51 percent to 44 percent.
If this improvement is reflective of overall buying patterns and continues, this change in consumer preference alone would reduce greenhouse gas (GHG) emissions in the United States by approximately 43,000,000 metric tons per year.
See: US Consumer Choice in Automobiles
In the first 6 months of 2008, the average fuel economy of these 20 vehicles was 23.7 miles per gallon. This is an improvement of nearly 4 percent from 2007. Over the period, the share of SUVs among these vehicles fell from 51 percent to 44 percent.
If this improvement is reflective of overall buying patterns and continues, this change in consumer preference alone would reduce greenhouse gas (GHG) emissions in the United States by approximately 43,000,000 metric tons per year.
See: US Consumer Choice in Automobiles
Car Use Expands in San Francisco Bay Area at 3-Times National Rate
Car travel in the San Francisco Bay is rising rapidly, at more than three times the national rate per capita. Data from the Metropolitan Transportation Commission indicates that from 2000 to 2007, total daily vehicle miles traveled increased from 140,100,000 to 152,100,000. Per capita driving increased from 20.6 miles to 22.2 miles, an increase of 7.6 percent.
By comparison, the national increase in driving per capita over the same period was 2.1 percent.
United States Bureau of the Census data shows that the San Francisco Bay Area has slipped into laggard growth, having added only 0.3 percent to its population annually. This is a slower growth rate than Italy. The Bay Area has become one of the nation’s slowest growing areas, at least partially due to huge increases in housing costs.
See: San Francisco Bay Area Travel Data
By comparison, the national increase in driving per capita over the same period was 2.1 percent.
United States Bureau of the Census data shows that the San Francisco Bay Area has slipped into laggard growth, having added only 0.3 percent to its population annually. This is a slower growth rate than Italy. The Bay Area has become one of the nation’s slowest growing areas, at least partially due to huge increases in housing costs.
See: San Francisco Bay Area Travel Data
Urban Driving Loss Moderated in April: Intercity Decline Expands
New data from the US Department of Transportation indicates that driving in urban areas declined only 1.0 percent in April 2008 compared to April 2007. This is despite the continuing increase in gasoline prices.
The April figure compares to the 3.8 percent decline in March relative to the previous year.
Inter-city driving volumes appear to be suffering the largest declines. In April, traffic on urban interstate highways (motorways or autoroutes) was down 5.2 percent from the previous year. This is more than 4 times the decline in urban driving.
As was noted in a previous entry, the press has been filled with stories to the effect that people are abandoning their cars for mass transit. In the first quarter, transit replaced no more than 3 percent of the decline in urban travel by car. This is a simple consequence of convenient mass transit service not being available for the overwhelming majority of urban trips. With an urban market share of below 2 percent, it would take a 50 percent increase in transit market share to accomodate a 1 percent decline in urban travel by car. Outside the New York metropolitan area, the increase would need to be 100 percent, because of the much smaller market share.
In the longer run, it is likely that driving will stablize as households switch to more fuel efficient vehicles. In the first six months of the year, there appears to have been a nearly 1 mile per gallon increase in the fuel economy of new cars and SUVs sold in the United States compared to the previous year.
The April figure compares to the 3.8 percent decline in March relative to the previous year.
Inter-city driving volumes appear to be suffering the largest declines. In April, traffic on urban interstate highways (motorways or autoroutes) was down 5.2 percent from the previous year. This is more than 4 times the decline in urban driving.
As was noted in a previous entry, the press has been filled with stories to the effect that people are abandoning their cars for mass transit. In the first quarter, transit replaced no more than 3 percent of the decline in urban travel by car. This is a simple consequence of convenient mass transit service not being available for the overwhelming majority of urban trips. With an urban market share of below 2 percent, it would take a 50 percent increase in transit market share to accomodate a 1 percent decline in urban travel by car. Outside the New York metropolitan area, the increase would need to be 100 percent, because of the much smaller market share.
In the longer run, it is likely that driving will stablize as households switch to more fuel efficient vehicles. In the first six months of the year, there appears to have been a nearly 1 mile per gallon increase in the fuel economy of new cars and SUVs sold in the United States compared to the previous year.
Ville de Paris to Allow Skyscrapers?
The ville de Paris government has decided to consider allowing skyscrapers, after a more than 30 year bad (precipitated by the Darth Vaderite Tour Montparnasse).
On one hand, such a move could, in the long run, seriously retard the attractiveness of Paris as a tourist site --- the city, especially the core, is itself a museum. On the other hand, allowing the building market to develop what the customer market seeks can only make the ville de Paris more competitive in its metropolitan region, the Ile-de-France. The ville de Paris has taken serious losses in employment in the last two decades, as companies have increasingly moved or been established in the suburbs.
However, Paris will continue to have a serious competitive disadvantage with the artificial traffic constraints that have made parts of the ville a recurring traffic jam, as traffic lanes have been taken from general traffic use, in favor of buses, which have seen virtually no material increase in ridership.
High Rises in the Ville de Paris?
On one hand, such a move could, in the long run, seriously retard the attractiveness of Paris as a tourist site --- the city, especially the core, is itself a museum. On the other hand, allowing the building market to develop what the customer market seeks can only make the ville de Paris more competitive in its metropolitan region, the Ile-de-France. The ville de Paris has taken serious losses in employment in the last two decades, as companies have increasingly moved or been established in the suburbs.
However, Paris will continue to have a serious competitive disadvantage with the artificial traffic constraints that have made parts of the ville a recurring traffic jam, as traffic lanes have been taken from general traffic use, in favor of buses, which have seen virtually no material increase in ridership.
High Rises in the Ville de Paris?
2008/07/08
Gas Price Increase in Context
Much of the increase in gasoline costs in the United States is simply the result of a weakening dollar.
If the dollar had retained its value relative to the Euro as of January 1, 2002, the price of gasoline would be approximately $2.25 per gallon today (assuming a present price of $4.00).
The strength of the Euro has shielded Europe from the huge gas price increases experienced in the United States. Gas prices are up, but by far less in percentage terms than in the US.
If the dollar had retained its value relative to the Euro as of January 1, 2002, the price of gasoline would be approximately $2.25 per gallon today (assuming a present price of $4.00).
The strength of the Euro has shielded Europe from the huge gas price increases experienced in the United States. Gas prices are up, but by far less in percentage terms than in the US.
China to the G-8?
It would seem reasonable for the G-8 to be expanded to include the world's second largest national economy - China.
Moreover, it would be useful to extend the invitation before China itself becomes the "G-1," by virtue of its explosive growth.
Moreover, it would be useful to extend the invitation before China itself becomes the "G-1," by virtue of its explosive growth.
2008/07/07
Responding to Mayor Hanneman’s Personal Attack
It is hard to recall a more foolish expenditure than that made by Mayor Mufi Hanneman of the city and county of Honolulu in a campaign of personal invective against me.
The Situation
Here is the remarkable story.
1. The Honolulu Advertiser published a letter from the mayor in which he noted Honolulu's superior carbon footprint rating as reported in a Brookings Institution report. In the letter he made a positive reference to the proposed Honolulu urban rail project, which he supports (Note 1, below).
2. When I became aware of the letter, I sent a "tongue in cheek" letter to the editor on the subject of Honolulu's carbon footprint, the point of which was to note that Honolulu's rating was both deserved and not deserved. I implied that Honolulu would not have scored so well if it had been founded on Michigan's Upper Peninsula (where much colder conditions would require far more energy for heating, and thus more CO2 emissions). I also gave Honolulu credit for its high transit market share, which despite having no rail has often equaled or exceeded the market shares of all urban areas in the nation, except for New York. My letter suggested that this favorable situation was not likely to be made any better by building the urban rail system (Note 2, below).
The Over-Reaction
The latter casual (though correct) comment in a letter not principally about urban rail led the Mayor to take out near-full page ads in two metropolitan newspapers on Sunday, June 22. The ad was run again on Monday in one of the newspapers. This costs money. The ads were directed in part at me, but also were highly critical of local rail system opponents. In a sense I suppose that I should take pride that the Mayor is so terrified that I might bring my analysis of his rail system to Honolulu.
Cause for Concern
I have no interest in responding to the Mayor’s ad hominem attacks.
Prudent public policy is often trumped by what the Germans call "realpolitic" (policy based on power rather than the public good). Indeed, when proponents of megaprojects stoop to ad hominem attacks it often tends to mask feeble analysis and facts that do not justify the large expenditures. However, it is the facts, not the personalities that matter. Personalizing the debate makes does nothing to make a questionable project less questionable.
The mayor's over-reaction at the prospect of my entering the policy debate should give pause. Local Honolulu analysts have already pointed out the grim reality --- that this extravagant rail line is likely to require more of a share of metropolitan area income than any in US history --- and by a long shot. One can only hope that the citizens of the city and county of Honolulu will have an opportunity to decide this issue at the ballot box, rather than having substantial tax increases imposed without their consent.
Wendell Cox
Principal, Demographia (St. Louis)
Visiting Professor, Conservatoire National des Arts et Metiers, Paris
Member, Los Angeles County Transportation Commission (1977-1985)
Member, Amtrak Reform Council (1999-2002)
Note 1:
MAYOR HANNEMAN'S LETTER TO THE HONOLULU ADVERTISER
No. 1 Ranking Report Confirms City Going in Right Direction
The new Brookings Institution report that ranked Honolulu No. 1 out of 100 U.S. cities for our low carbon emissions was great news, but we will not be content to rest on our laurels.
We're moving forward aggressively on many important initiatives to further protect our environment and enhance our quality of life.
Our rail transit project is exactly what's needed to provide key improvements cited by the study to reduce pollution: Promote more transportation choices and transit-oriented development.
The study found that cities with rail mass transit systems and densely populated urban cores have far smaller "carbon footprints" per capita than sprawling metropolitan areas dependent on private vehicles. Our rail system will give thousands of commuters and visitors an alternative to private vehicles and clogged freeways, while providing important opportunities for new housing, commercial space and public facilities along the rail line.
Our 21st Century Ahupua'a Plan closely examined other environmentally friendly policies, and they are now reaching fruition. We're continually expanding curbside residential recycling, replacing buses and police cars with efficient hybrid vehicles, increasing the capacity of the H-Power garbage-to-energy plant, operating ferries from Kalaeloa to Aloha Tower and adding bicycle lanes to our roadways.
A few will always nit-pick when good news is announced, but we're confident that the Brookings report provided an honest assessment of Honolulu's ranking and made it clear that we are moving in the right direction with rail transit and other important initiatives. Our goal remains to leave Honolulu better than we found it.
Mayor Mufi Hannemann
City and County of Honolulu
Note 2
MY LETTER TO THE HONOLULU ADVERTISER (June 2)
To the Editor
The Honolulu Advertiser
The Mayor boasts about Honolulu's superior carbon footprint and some boasting is appropriate.
It is no surprise that Honolulu has one of the smaller transportation footprints in the nation. With its bus system, Honolulu often ranks second in the nation in transit market share to the New York area. It is hard to imagine that the proposed, expensive rail system will make that any better.
As for residential energy, had the city founders instead chosen a location on Michigan's Upper Peninsula, things would look much worse. Honolulu's modest residential carbon footprint is a function of Hawaii's marvelous climate, which reduces energy demand substantially.
Sincerely,
Wendell Cox
Principal, Demographia, St. Louis
The Situation
Here is the remarkable story.
1. The Honolulu Advertiser published a letter from the mayor in which he noted Honolulu's superior carbon footprint rating as reported in a Brookings Institution report. In the letter he made a positive reference to the proposed Honolulu urban rail project, which he supports (Note 1, below).
2. When I became aware of the letter, I sent a "tongue in cheek" letter to the editor on the subject of Honolulu's carbon footprint, the point of which was to note that Honolulu's rating was both deserved and not deserved. I implied that Honolulu would not have scored so well if it had been founded on Michigan's Upper Peninsula (where much colder conditions would require far more energy for heating, and thus more CO2 emissions). I also gave Honolulu credit for its high transit market share, which despite having no rail has often equaled or exceeded the market shares of all urban areas in the nation, except for New York. My letter suggested that this favorable situation was not likely to be made any better by building the urban rail system (Note 2, below).
The Over-Reaction
The latter casual (though correct) comment in a letter not principally about urban rail led the Mayor to take out near-full page ads in two metropolitan newspapers on Sunday, June 22. The ad was run again on Monday in one of the newspapers. This costs money. The ads were directed in part at me, but also were highly critical of local rail system opponents. In a sense I suppose that I should take pride that the Mayor is so terrified that I might bring my analysis of his rail system to Honolulu.
Cause for Concern
I have no interest in responding to the Mayor’s ad hominem attacks.
Prudent public policy is often trumped by what the Germans call "realpolitic" (policy based on power rather than the public good). Indeed, when proponents of megaprojects stoop to ad hominem attacks it often tends to mask feeble analysis and facts that do not justify the large expenditures. However, it is the facts, not the personalities that matter. Personalizing the debate makes does nothing to make a questionable project less questionable.
The mayor's over-reaction at the prospect of my entering the policy debate should give pause. Local Honolulu analysts have already pointed out the grim reality --- that this extravagant rail line is likely to require more of a share of metropolitan area income than any in US history --- and by a long shot. One can only hope that the citizens of the city and county of Honolulu will have an opportunity to decide this issue at the ballot box, rather than having substantial tax increases imposed without their consent.
Wendell Cox
Principal, Demographia (St. Louis)
Visiting Professor, Conservatoire National des Arts et Metiers, Paris
Member, Los Angeles County Transportation Commission (1977-1985)
Member, Amtrak Reform Council (1999-2002)
Note 1:
MAYOR HANNEMAN'S LETTER TO THE HONOLULU ADVERTISER
No. 1 Ranking Report Confirms City Going in Right Direction
The new Brookings Institution report that ranked Honolulu No. 1 out of 100 U.S. cities for our low carbon emissions was great news, but we will not be content to rest on our laurels.
We're moving forward aggressively on many important initiatives to further protect our environment and enhance our quality of life.
Our rail transit project is exactly what's needed to provide key improvements cited by the study to reduce pollution: Promote more transportation choices and transit-oriented development.
The study found that cities with rail mass transit systems and densely populated urban cores have far smaller "carbon footprints" per capita than sprawling metropolitan areas dependent on private vehicles. Our rail system will give thousands of commuters and visitors an alternative to private vehicles and clogged freeways, while providing important opportunities for new housing, commercial space and public facilities along the rail line.
Our 21st Century Ahupua'a Plan closely examined other environmentally friendly policies, and they are now reaching fruition. We're continually expanding curbside residential recycling, replacing buses and police cars with efficient hybrid vehicles, increasing the capacity of the H-Power garbage-to-energy plant, operating ferries from Kalaeloa to Aloha Tower and adding bicycle lanes to our roadways.
A few will always nit-pick when good news is announced, but we're confident that the Brookings report provided an honest assessment of Honolulu's ranking and made it clear that we are moving in the right direction with rail transit and other important initiatives. Our goal remains to leave Honolulu better than we found it.
Mayor Mufi Hannemann
City and County of Honolulu
Note 2
MY LETTER TO THE HONOLULU ADVERTISER (June 2)
To the Editor
The Honolulu Advertiser
The Mayor boasts about Honolulu's superior carbon footprint and some boasting is appropriate.
It is no surprise that Honolulu has one of the smaller transportation footprints in the nation. With its bus system, Honolulu often ranks second in the nation in transit market share to the New York area. It is hard to imagine that the proposed, expensive rail system will make that any better.
As for residential energy, had the city founders instead chosen a location on Michigan's Upper Peninsula, things would look much worse. Honolulu's modest residential carbon footprint is a function of Hawaii's marvelous climate, which reduces energy demand substantially.
Sincerely,
Wendell Cox
Principal, Demographia, St. Louis
2008/06/28
World Urban Areas: Population, Density & Projections Released
http://www.demographia.com/db-worldua.pdf
Demographia announces publication of World Urban Areas & Population Projections. World Urban Areas & Population Projections remains the only known source in the world for comprehensive and consistent estimates of urban land area and densities. This 4th comprehensive edition replaces publications released in March of 2007. The product includes:
(1) Population, land area and density estimates for all 723 identified urban agglomerations in the world with 500,000 or more in population. In all, 1,316 urban areas are included, representing 50 percent of the world urban population. Tables are provided in population, land area, population density and alphabetical order.
(2) There is also a summary of the data by the largest nations and major world regions.
(3) Population projections for all 204 urban agglomerations anticipated to have 2,000,000 or more residents in 2025. There is also a projection of the 2008 population of all such urban areas. Tables are provided in alphabetical order and population order by 2008 and 2025 projections
Demographia announces publication of World Urban Areas & Population Projections. World Urban Areas & Population Projections remains the only known source in the world for comprehensive and consistent estimates of urban land area and densities. This 4th comprehensive edition replaces publications released in March of 2007. The product includes:
(1) Population, land area and density estimates for all 723 identified urban agglomerations in the world with 500,000 or more in population. In all, 1,316 urban areas are included, representing 50 percent of the world urban population. Tables are provided in population, land area, population density and alphabetical order.
(2) There is also a summary of the data by the largest nations and major world regions.
(3) Population projections for all 204 urban agglomerations anticipated to have 2,000,000 or more residents in 2025. There is also a projection of the 2008 population of all such urban areas. Tables are provided in alphabetical order and population order by 2008 and 2025 projections
2008/06/23
Consultant Memo on Houston Misleads Tauranga Council
A Tauranga Councillor (New Zealand) raised questions about “smart growth” (prescriptive land use planning) in relation to the superior housing affordability of Houston, where no such policies exist. The resulting memorandum in response is evaluated below.
Principal Points
1. All of Texas is affordable and most of Texas is unzoned.
2. Houston’s affordable housing is not just on the urban fringe, contrary to the statement in the memo.
3. Houston’s suburbanization (or “sprawl”) is about average and not much greater than Portland’s.
4. Houston’s traffic congestion has been materially improved by road construction.
5. Houston’s traffic moves considerably faster than Auckland’s.
6. The loss of housing affordability is associated with smart growth-style land use policies.
Houston and Texas: Superior Housing Affordability
The city of Houston (local government authority) has no zoning, which the memo rightly points out. Virtually all of the other local government authorities in the Houston metropolitan area have zoning. However, most of the land in the Houston metropolitan area is unzoned, because it is outside local government authority areas and under the jurisdiction of counties. In Texas, counties have no zoning power. Thus, while local government authorities in Texas outside the city of Houston generally have zoning, they are forced to operate in a competitive environment under which housing can be readily built, without zoning, in adjacent unincorporated areas. Indeed, given this competitive environment, it is appropriate to think of the state of Texas as unzoned (environmental regulation, which is established at the state and federal level is observed).
The memo notes that Dallas (actually the Dallas-Fort Worth metropolitan area) has slightly better housing affordability than the Houston metropolitan area as measured by the Median Multiple (median house price divided by the median household income). The important point is that both metropolitan areas are below the historic maximum norm of 3.0. By comparison, the Median Multiple in Tauranga was 7.5 in the third quarter of 2007 (Auckland was 6.9). This means that residents of these New Zealand urban centres face relative home ownership costs more than 2.5 times those of Houston, Dallas-Fort Worth and a number of US and Canadian metropolitan areas that have not adopted smart growth policies.
Affordable Housing in Houston: Not Limited to the Fringe
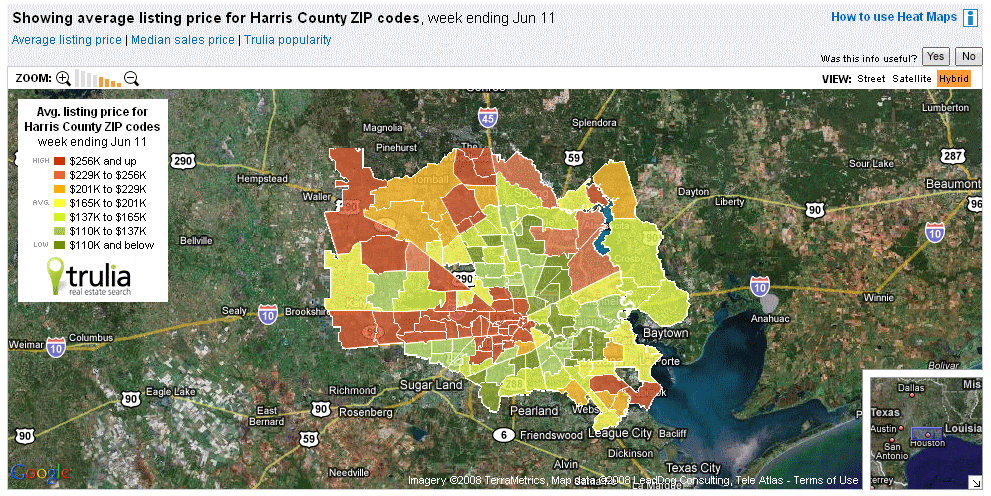
The memo indicates that housing is affordable only on Houston’s fringe. This is absurd and betrays an acute unfamiliarity with Houston housing markets. The referenced map shows house asking prices in Harris County (which is core of the urban area). Affordable housing is to be found throughout the metropolitan area Indeed, the low bound of the highest price category is lower than the median house price in Tauranga. No one would expect the consultant to have expertise on Houston housing markets. It does seem inappropriate, however, for the consultant to be erroneously opining that affordable housing is available only on the fringe
Houston’s "Sprawl:" Like Portland
As for Houston's suburbanization, (pejoratively called "sprawl,") the urban area (urban footprint) is approximately average the density for a US urban area over 1,000,000. It is only 10 percent less dense than Portland, despite that urban area's strong smart growth policies. Houston’s density is virtually the same as that of Dallas-Fort Worth and a quarter higher than that of Boston.
Traffic Congestion: Road Building Made it Better
The memo cites Houston as having some of the nation’s worst traffic congestion. It does --- the latest data shows that Houston ranks 8th in traffic congestion, which is not surprising for the nation’s 6th largest metropolitan area. Houston has done quite well. According to the Texas Transportation Institute (leading authority in the US on the subject), Houston had the worst traffic congestion in the US in the middle 1980s (among urban areas of more than 1,000,000 population). After a strong road building program, traffic congestion was materially reduced (though has increased in more recent years, since the road construction program has not kept up with population growth). By the mid-1990s, Houston had improved to 23rd place.
Since the middle 1990s, population growth has outstripped highway expansion and Houston has risen back to rank 8th in traffic congestion (Houston is one of the three fastest growing metropolitan areas over 5,000,000 population in the high income world). Houston has done better than smart growth Portland over the past 20 years, which has seen its excess peak hour traffic delay (based on the Travel Time Index) rise from approximately 1/4 that of Houston to 3/4 that of Houston.
Houston Traffic Moves Faster than Auckland Traffic
Finally, average travel speeds on the motorway and arterial network in Houston were more than 60 kph in 2002 (latest data from the Texas Transportation Institute). By comparison, according to the New Zealand Travel Time Indicator report, the average peak period travel times on the motorway and arterial network of Auckland was 36 kph in 2007.
Smart Growth Land Use Policy: The Root of New Zealand’s Unaffordable Housing
The report misses the point that New Zealand’s housing affordability loss is the result of overly prescriptive land use planning (smart growth or urban consolidation policy). This connection has been identified by some of the world’s top economists and is detailed in our 4th Annual Demographia International Housing Affordability Survey. The situation was best summed up by former Reserve Bank of New Zealand Governor Donald Brash, writing in the Demographia report: the affordability of housing is overwhelmingly a function of just one thing, the extent to which governments place artificial restrictions on the supply of residential land.. In short, where there are no prescriptive land use policies, housing is affordable. Among the six nations surveyed in our report, there are no exceptions.
Addendum: Understanding US Urban Geography
The memo exhibits the usual (and understandable) confusion about US urban geography. The memo refers to the city of Houston (which is a local government authority or municipality of 2 million population). The referenced housing affordability measures apply to the metropolitan area, which has 5.5 million people. There is also the Houston urban area (or agglomeration), which has more than 4,000,000 people (the difference between the agglomeration and the metropolitan area is that the urban area is the continuous urbanization (or urban footprint), while the metropolitan area includes areas considered in the labor market that are outside the urban area and generally in rural areas. Urban area and metropolitan area are formal designations by the US Bureau of the Census.
Principal Points
1. All of Texas is affordable and most of Texas is unzoned.
2. Houston’s affordable housing is not just on the urban fringe, contrary to the statement in the memo.
3. Houston’s suburbanization (or “sprawl”) is about average and not much greater than Portland’s.
4. Houston’s traffic congestion has been materially improved by road construction.
5. Houston’s traffic moves considerably faster than Auckland’s.
6. The loss of housing affordability is associated with smart growth-style land use policies.
Houston and Texas: Superior Housing Affordability
The city of Houston (local government authority) has no zoning, which the memo rightly points out. Virtually all of the other local government authorities in the Houston metropolitan area have zoning. However, most of the land in the Houston metropolitan area is unzoned, because it is outside local government authority areas and under the jurisdiction of counties. In Texas, counties have no zoning power. Thus, while local government authorities in Texas outside the city of Houston generally have zoning, they are forced to operate in a competitive environment under which housing can be readily built, without zoning, in adjacent unincorporated areas. Indeed, given this competitive environment, it is appropriate to think of the state of Texas as unzoned (environmental regulation, which is established at the state and federal level is observed).
The memo notes that Dallas (actually the Dallas-Fort Worth metropolitan area) has slightly better housing affordability than the Houston metropolitan area as measured by the Median Multiple (median house price divided by the median household income). The important point is that both metropolitan areas are below the historic maximum norm of 3.0. By comparison, the Median Multiple in Tauranga was 7.5 in the third quarter of 2007 (Auckland was 6.9). This means that residents of these New Zealand urban centres face relative home ownership costs more than 2.5 times those of Houston, Dallas-Fort Worth and a number of US and Canadian metropolitan areas that have not adopted smart growth policies.
Affordable Housing in Houston: Not Limited to the Fringe
The memo indicates that housing is affordable only on Houston’s fringe. This is absurd and betrays an acute unfamiliarity with Houston housing markets. The referenced map shows house asking prices in Harris County (which is core of the urban area). Affordable housing is to be found throughout the metropolitan area Indeed, the low bound of the highest price category is lower than the median house price in Tauranga. No one would expect the consultant to have expertise on Houston housing markets. It does seem inappropriate, however, for the consultant to be erroneously opining that affordable housing is available only on the fringe
Houston’s "Sprawl:" Like Portland
As for Houston's suburbanization, (pejoratively called "sprawl,") the urban area (urban footprint) is approximately average the density for a US urban area over 1,000,000. It is only 10 percent less dense than Portland, despite that urban area's strong smart growth policies. Houston’s density is virtually the same as that of Dallas-Fort Worth and a quarter higher than that of Boston.
Traffic Congestion: Road Building Made it Better
The memo cites Houston as having some of the nation’s worst traffic congestion. It does --- the latest data shows that Houston ranks 8th in traffic congestion, which is not surprising for the nation’s 6th largest metropolitan area. Houston has done quite well. According to the Texas Transportation Institute (leading authority in the US on the subject), Houston had the worst traffic congestion in the US in the middle 1980s (among urban areas of more than 1,000,000 population). After a strong road building program, traffic congestion was materially reduced (though has increased in more recent years, since the road construction program has not kept up with population growth). By the mid-1990s, Houston had improved to 23rd place.
Since the middle 1990s, population growth has outstripped highway expansion and Houston has risen back to rank 8th in traffic congestion (Houston is one of the three fastest growing metropolitan areas over 5,000,000 population in the high income world). Houston has done better than smart growth Portland over the past 20 years, which has seen its excess peak hour traffic delay (based on the Travel Time Index) rise from approximately 1/4 that of Houston to 3/4 that of Houston.
Houston Traffic Moves Faster than Auckland Traffic
Finally, average travel speeds on the motorway and arterial network in Houston were more than 60 kph in 2002 (latest data from the Texas Transportation Institute). By comparison, according to the New Zealand Travel Time Indicator report, the average peak period travel times on the motorway and arterial network of Auckland was 36 kph in 2007.
Smart Growth Land Use Policy: The Root of New Zealand’s Unaffordable Housing
The report misses the point that New Zealand’s housing affordability loss is the result of overly prescriptive land use planning (smart growth or urban consolidation policy). This connection has been identified by some of the world’s top economists and is detailed in our 4th Annual Demographia International Housing Affordability Survey. The situation was best summed up by former Reserve Bank of New Zealand Governor Donald Brash, writing in the Demographia report: the affordability of housing is overwhelmingly a function of just one thing, the extent to which governments place artificial restrictions on the supply of residential land.. In short, where there are no prescriptive land use policies, housing is affordable. Among the six nations surveyed in our report, there are no exceptions.
Addendum: Understanding US Urban Geography
The memo exhibits the usual (and understandable) confusion about US urban geography. The memo refers to the city of Houston (which is a local government authority or municipality of 2 million population). The referenced housing affordability measures apply to the metropolitan area, which has 5.5 million people. There is also the Houston urban area (or agglomeration), which has more than 4,000,000 people (the difference between the agglomeration and the metropolitan area is that the urban area is the continuous urbanization (or urban footprint), while the metropolitan area includes areas considered in the labor market that are outside the urban area and generally in rural areas. Urban area and metropolitan area are formal designations by the US Bureau of the Census.
2008/06/14
On the Success of Airline Deregulation
Missing the Point
Re: Airline Deregulation Article: April 17
http://www.nytimes.com/2008/04/17/business/17air.html
To Micheline Maynard
New York Times
Just saw your column in the New York Times.
Perhaps I missed something, but it is astounding that you could have written an article assessing airline deregulation and not have prominently mentioned the impacts on consumers --- that deregulation has been associated with a huge increase in passenger usage, that simply could not have happened in the regulated environment.
This article seems to convey a much greater concern about producers than consumers. Businesses and society, in the final analysis, exist for the good of consumers and by that standard, airline deregulation has been a huge success.
Best regards,
Wendell Cox
Principal, Demographia (St. Louis)
Visiting Professor, Conservatoire National des Arts et Metiers (Paris)
Re: Airline Deregulation Article: April 17
http://www.nytimes.com/2008/04/17/business/17air.html
To Micheline Maynard
New York Times
Just saw your column in the New York Times.
Perhaps I missed something, but it is astounding that you could have written an article assessing airline deregulation and not have prominently mentioned the impacts on consumers --- that deregulation has been associated with a huge increase in passenger usage, that simply could not have happened in the regulated environment.
This article seems to convey a much greater concern about producers than consumers. Businesses and society, in the final analysis, exist for the good of consumers and by that standard, airline deregulation has been a huge success.
Best regards,
Wendell Cox
Principal, Demographia (St. Louis)
Visiting Professor, Conservatoire National des Arts et Metiers (Paris)
2008/06/03
Historic Annapolis Core Threatened by New Urbanist Interloper
A City Struggles To Find Its Niche: Competition Has Annapolis Planners Pondering How to Save Downtown
New urbanists have long claimed to admire traditional urban cores (downtowns) and sought to replicate them in new developments. However, their admiration of genuine urbanism is shown to be wanting, as revealed by the opening of the Annapolis Town Centre, which today’s Washington Post indicates is not only not in Annapolis, but could well decimate the already struggling, genuine core of Annapolis.
Thus, the contempt that new urbanists have toward how the majority of people have chosen to live, appears to extend to the very districts they claim to adore. It may be that new urbanism is more about securing fees for architects than maintaining urban cores
New urbanists have long claimed to admire traditional urban cores (downtowns) and sought to replicate them in new developments. However, their admiration of genuine urbanism is shown to be wanting, as revealed by the opening of the Annapolis Town Centre, which today’s Washington Post indicates is not only not in Annapolis, but could well decimate the already struggling, genuine core of Annapolis.
Thus, the contempt that new urbanists have toward how the majority of people have chosen to live, appears to extend to the very districts they claim to adore. It may be that new urbanism is more about securing fees for architects than maintaining urban cores
Transit Ridership Increase in Context
Note to Lena Sun of the Washington Post
Re June 3 article
In context, the transit increase represents somewhere around 5 percent of the urban driving decline... which indicates that while driving is down, transit's ridership increase is up only a fraction of the decline.
Best regards,
Wendell Cox
Principal Demographia
Former Member, Los Angeles County Transportation Commission
Visiting Professor, Conservatoire National des Arts et Metiers
Re June 3 article
In context, the transit increase represents somewhere around 5 percent of the urban driving decline... which indicates that while driving is down, transit's ridership increase is up only a fraction of the decline.
Best regards,
Wendell Cox
Principal Demographia
Former Member, Los Angeles County Transportation Commission
Visiting Professor, Conservatoire National des Arts et Metiers
Lucky Honolulu Wasn't Founded on Upper Peninsula: The Brookings Metropolitan Carbon Footprint Report
Re: Mayor Hanneman Letter
June 2, 2008
To the Editor
The Honolulu Advertiser
The Mayor boasts about Honolulu’s superior carbon footprint and some boasting is appropriate.
It is no surprise that Honolulu has one of the smaller transportation footprints in the nation. With its bus system, Honolulu often ranks second in the nation in transit market share to the New York area. It is hard to imagine that the proposed, expensive rail system will make that any better.
As for residential energy, had the city founders instead chosen a location on Michigan’s Upper Peninsula, things would look much worse. Honolulu’s modest residential carbon footprint is a function of Hawaii’s marvelous climate, which reduces energy demand substantially.
Sincerely,
Wendell Cox
Principal, Demographia, St. Louis
June 2, 2008
To the Editor
The Honolulu Advertiser
The Mayor boasts about Honolulu’s superior carbon footprint and some boasting is appropriate.
It is no surprise that Honolulu has one of the smaller transportation footprints in the nation. With its bus system, Honolulu often ranks second in the nation in transit market share to the New York area. It is hard to imagine that the proposed, expensive rail system will make that any better.
As for residential energy, had the city founders instead chosen a location on Michigan’s Upper Peninsula, things would look much worse. Honolulu’s modest residential carbon footprint is a function of Hawaii’s marvelous climate, which reduces energy demand substantially.
Sincerely,
Wendell Cox
Principal, Demographia, St. Louis
Alex Marshall's Delusions About Anti-Transit Bias
Letter to the Editor
Hartford Courant
June 9, 2008
Response To 'Idealism Takes A Wrong Turn'
June 9, 2008
In response to Alex Marshall's June 1 Place article, "Idealism Takes A Wrong Turn," in which he criticized my views on cars and transit:
Marshall deludes himself about a bias toward highways and against mass transit. Indeed, government transit spending per passenger mile is nearly $0.95, while all government spending on roadways is less than $0.04. Some bias. Transit spending is 25 times highway spending. This does not consider the fact that roads carry a large share of the nation's freight. Transit carries none.
Further, government highway spending is principally from gasoline taxes on drivers, not subsidies from non-users. In contrast, more than 75 percent of transit spending comes from non-user subsidies.
Ending the bias would require transit to be funded by taxes on transit fares. This, of course, would be the end of transit.
Despite romantic notions to the contrary, we cannot replace the mobility of the automobile. This is not to deny transit's important roles in serving low-income households in city cores and its principal niche market, the 10 percent of jobs that are in downtown areas.
The unparalleled democratization of prosperity (read, poverty reduction) in Western Europe and the United States since World War II could not have happened without the mobility of the automobile and the new, owner-occupied houses on cheap suburban land.
Wendell Cox
Principal Demographia Metropolitan St. Louis Belleville, Ill.
The writer was a member of the Los Angeles County Transportation Committee, 1977-85.
Hartford Courant
June 9, 2008
Response To 'Idealism Takes A Wrong Turn'
June 9, 2008
In response to Alex Marshall's June 1 Place article, "Idealism Takes A Wrong Turn," in which he criticized my views on cars and transit:
Marshall deludes himself about a bias toward highways and against mass transit. Indeed, government transit spending per passenger mile is nearly $0.95, while all government spending on roadways is less than $0.04. Some bias. Transit spending is 25 times highway spending. This does not consider the fact that roads carry a large share of the nation's freight. Transit carries none.
Further, government highway spending is principally from gasoline taxes on drivers, not subsidies from non-users. In contrast, more than 75 percent of transit spending comes from non-user subsidies.
Ending the bias would require transit to be funded by taxes on transit fares. This, of course, would be the end of transit.
Despite romantic notions to the contrary, we cannot replace the mobility of the automobile. This is not to deny transit's important roles in serving low-income households in city cores and its principal niche market, the 10 percent of jobs that are in downtown areas.
The unparalleled democratization of prosperity (read, poverty reduction) in Western Europe and the United States since World War II could not have happened without the mobility of the automobile and the new, owner-occupied houses on cheap suburban land.
Wendell Cox
Principal Demographia Metropolitan St. Louis Belleville, Ill.
The writer was a member of the Los Angeles County Transportation Committee, 1977-85.
2008/06/01
GHG Emissions Less in Auto Oriented Suburbs than Urban Cores: Australia
Deflating the Myths on Greenhouse Gas Emissions
Policy Conclusions: This report summarizes the data developed by the Australian Conservation Foundation in its Conservation Atlas. This nearly 100-page report provides detailed information by local authority area (geographical sector) of Australia’s largest urban areas. The conclusions are different than would have been anticipated.
Lower GHG emissions are associated with urban fringe locations, not the core.
Lower GHG emissions are associated with higher rates of detached housing.
Lower GHG emissions are associated with greater automobile use.
Lower GHG emissions are associated with lower population density.
Repealing the “Great Australian Dream”? Climate change concerns have propelled the issue of reducing greenhouse gas emissions to the top of the public policy agenda. For some years the urban planning community and other interests have sought to contain urban expansion (pejoratively called “urban sprawl”) and force more dense development through policies referred to as “smart growth” or “urban consolidation.” There is a presumed preference for multi-unit residential development in city cores and an aversion against low-priced detached housing on the urban fringe. An important objective of these policies has been to reduce automobile use, which it is assumed will naturally occur as a result of higher urban densities,
In Australia, these policies have seriously limited the availability of market priced land on the urban fringe and driven house prices up at a far greater rate than has occurred in international urban areas where compact city policies have not been implemented. Thus, the present dominant policies are at odds with the “Great Australian Dream,” which has been based upon detached housing on the fringe and automobile access.
Smart Growth and GHG Emissions: The urban consolidation agenda is perceived by many to be an appropriate strategy for reducing GHG emissions. Part of this is due to the fact that automobiles are an obvious example of fossil fuel use.
Generally, urban planning policy assumes that greenhouse gas emissions are higher in portions of urban areas that are more suburban, especially areas in which there is a preponderance of single-family detached housing. There is also the assumption that greenhouse gas emissions are lower in higher density areas, especially where there are more high-rise condominium and apartment buildings. And, as noted above, a parallel perception is that greenhouse gas emissions are greater in portions of the urban area that rely more on cars, and less where there is greater dependence on public transport. Finally, higher population densities are associated with lower GHG emissions.
The Reality: However, reducing GHG emissions is not so simple as to be achieved through the urban consolidation agenda. Indeed, there is considerable evidence to the contrary.
GHG emission estimates from the recently published Australian Conservation Foundation Consumption Atlas, indicates virtually the opposite of the generally held perceptions. The data shows that lower density areas, which rely more on automobiles, tend to produce less in GHG emissions than the high density, more public transport dependent areas that are favored by urban consolidation policies.
The reality, as indicated by data from the Australian Conservation Foundation’s Consumption Atlas is virtually the opposite.
The Consumption Atlas: The Consumption Atlas relies on a holistic approach, which allocates greenhouse gas emissions to final consumption at the household level. This includes not only direct energy consumption (such as household electricity use and automobile use) but also a much larger component, indirect energy consumption, which includes GHG emissions from electricity generation, manufacturing, processing, transport and otherwise producing consumer products. The Consumption Atlas provides a groundbreaking model for GHG emission analysis that establishes a model for the field, not only for Australia but also around the world.
The approach of the Consumption Atlas avoids what could deteriorate into agenda-driven approaches that focus only on the particular GHG producing sectors that are in the political sites of interest groups. Any approach that begins at any level other than allocating all GHG emissions to specific final consumption runs this risk. For example, the authors note that emphasis on direct consumption (such as automobile use and land use policy) may be “misdirected since direct energy use constitutes remarkably small portion of the total energy requirement over a range of incomes.”
The more important risk is that agenda-driven policies may fail to achieve the objective of substantially reducing GHG emissions. Any serious, good faith program for reducing emissions must be based upon comprehensive analysis that does not begin with pre-conceived notions, despite their popularity even at the highest policy levels.
Note: This report was prepared by Demographia for the Residential Development Council of the Property Council of Australia.
Policy Conclusions: This report summarizes the data developed by the Australian Conservation Foundation in its Conservation Atlas. This nearly 100-page report provides detailed information by local authority area (geographical sector) of Australia’s largest urban areas. The conclusions are different than would have been anticipated.
Lower GHG emissions are associated with urban fringe locations, not the core.
Lower GHG emissions are associated with higher rates of detached housing.
Lower GHG emissions are associated with greater automobile use.
Lower GHG emissions are associated with lower population density.
Repealing the “Great Australian Dream”? Climate change concerns have propelled the issue of reducing greenhouse gas emissions to the top of the public policy agenda. For some years the urban planning community and other interests have sought to contain urban expansion (pejoratively called “urban sprawl”) and force more dense development through policies referred to as “smart growth” or “urban consolidation.” There is a presumed preference for multi-unit residential development in city cores and an aversion against low-priced detached housing on the urban fringe. An important objective of these policies has been to reduce automobile use, which it is assumed will naturally occur as a result of higher urban densities,
In Australia, these policies have seriously limited the availability of market priced land on the urban fringe and driven house prices up at a far greater rate than has occurred in international urban areas where compact city policies have not been implemented. Thus, the present dominant policies are at odds with the “Great Australian Dream,” which has been based upon detached housing on the fringe and automobile access.
Smart Growth and GHG Emissions: The urban consolidation agenda is perceived by many to be an appropriate strategy for reducing GHG emissions. Part of this is due to the fact that automobiles are an obvious example of fossil fuel use.
Generally, urban planning policy assumes that greenhouse gas emissions are higher in portions of urban areas that are more suburban, especially areas in which there is a preponderance of single-family detached housing. There is also the assumption that greenhouse gas emissions are lower in higher density areas, especially where there are more high-rise condominium and apartment buildings. And, as noted above, a parallel perception is that greenhouse gas emissions are greater in portions of the urban area that rely more on cars, and less where there is greater dependence on public transport. Finally, higher population densities are associated with lower GHG emissions.
The Reality: However, reducing GHG emissions is not so simple as to be achieved through the urban consolidation agenda. Indeed, there is considerable evidence to the contrary.
GHG emission estimates from the recently published Australian Conservation Foundation Consumption Atlas, indicates virtually the opposite of the generally held perceptions. The data shows that lower density areas, which rely more on automobiles, tend to produce less in GHG emissions than the high density, more public transport dependent areas that are favored by urban consolidation policies.
The reality, as indicated by data from the Australian Conservation Foundation’s Consumption Atlas is virtually the opposite.
The Consumption Atlas: The Consumption Atlas relies on a holistic approach, which allocates greenhouse gas emissions to final consumption at the household level. This includes not only direct energy consumption (such as household electricity use and automobile use) but also a much larger component, indirect energy consumption, which includes GHG emissions from electricity generation, manufacturing, processing, transport and otherwise producing consumer products. The Consumption Atlas provides a groundbreaking model for GHG emission analysis that establishes a model for the field, not only for Australia but also around the world.
The approach of the Consumption Atlas avoids what could deteriorate into agenda-driven approaches that focus only on the particular GHG producing sectors that are in the political sites of interest groups. Any approach that begins at any level other than allocating all GHG emissions to specific final consumption runs this risk. For example, the authors note that emphasis on direct consumption (such as automobile use and land use policy) may be “misdirected since direct energy use constitutes remarkably small portion of the total energy requirement over a range of incomes.”
The more important risk is that agenda-driven policies may fail to achieve the objective of substantially reducing GHG emissions. Any serious, good faith program for reducing emissions must be based upon comprehensive analysis that does not begin with pre-conceived notions, despite their popularity even at the highest policy levels.
Note: This report was prepared by Demographia for the Residential Development Council of the Property Council of Australia.
Subscribe to:
Posts (Atom)